Week Nine
| Sitio: | Moodle ZČU |
| Curso: | UJP/AST6 Anglický jazyk pro Fakultu strojní 6 - šablona |
| Libro: | Week Nine |
| Imprimido por: | Gast |
| Día: | domingo, 8 de noviembre de 2026, 22:33 |
Descripción
Information about week nine.
1. Information
After this unit you should be able to:
2. Tasks and Dates
This unit consists of five activities. In the first activity, you will learn about different types of graphs. Then you will listen to a description of a graph and look at some useful nouns and verbs often used when describing graphs. After that, you will look at some more useful phrases and finally, you will try to describe a graph yourself.
2.1. Activity One
Read
the paragraphs. Each paragraph describes one type of graph. Complete the gaps with the following names of graphs. When
finished complete Quiz 9.1 to check your answers.
LINE GRAPH, PIE CHART, BAR CHART, COLUMN CHART, X-Y SCATTER PLOTS
a)__________________________
is used to
describe changes over short and long periods
of time.
b)____________________________ is used for
comparing parts of a whole. This graph does
not show changes over time.
c)___________________________
is used to
compare things between different groups or to
describe changes over time.
d)_____________________________
is used to
determine relationships between the two
different things. The x-axis is used to measure
one variable and the y-axis is used to measure
the other variable.
2.2. Activity Two
Listen to the recording and fill in the missing information. Then read the text
again and find the graph which it describes.
Recording:
Let ́s look at the graph on this slide. As you can see, the vertical 1) ______________
represents the production of our mini cars in per cents and the 2) _________________ axis is
divided into sections, each representing two years of production. In 2000 the production 3)
_______________ 18 % of the total car production, but due to the crisis in steel production it
fell 4) ______________ to only 8% in 2002. Between 2002 and 2004 the production of mini
cars was 5) _________________. There was a 6) ___________ rise in 2004 and the
production reached 22% in 2006. In the next two years, the mini car production went down 7)
______________, but in 2008 it dropped from 18% to 7%. The graph shows that between
2010 and 2012 there was still a slight 8) ________________ in the mini car production.
This year we suppose that our production of mini cars will increase 9) ________________
6%. Our estimates are that due to the worldwide crisis in the oil industry, the production will 10)
_________________ till 2022. Then it will 11) ________________ to only 2% in 2024.
However, in 2026 the production of mini cars will 12) ______________ its maximum and 13)
___________ 24% of our total car production.
Now read the text in 2 again and answer the questions.
1) What happened to the mini car production in 2002?
2) What happened to the mini car production between 2002 and 2004?
3) What happened to the mini car production in 2008?
4) What happened to the mini car production between 2010 and 2012?
5) What will happen to the mini car production from 2012 to 2022?
6) What will happen to the mini car production in 2024?
7) What will happen to the mini car production in 2026?
Compete QUIZ 9.2 to check your answers.
2.3. Activity Three
Read the words/phrases and complete the table. You should divide the words/phrases into four groups according to the "movement/position" they describe.
to remain constant, to shoot up, to increase, the rise, to decrease, to flatten out, to go up, to level off, to drop, to rise, to hit a maximum/minimum, to fluctuate, the fluctuation, to fall, the fall, to climb, the drop, the climb, the increase, to recover, to peak, to plunge, the plunge, not change, to shoot down, the decrease, to go down, the recovery, the peak, to reach a peak
UP:
DOWN:
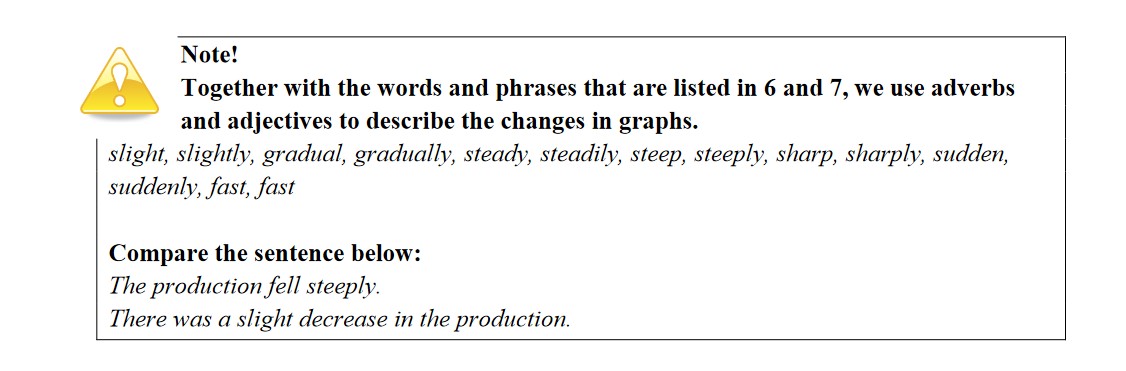
When talking about facts and figures, you can use nouns or verb structures. Remember, when using a verb to describe the change you can make it more specific/precise by adding an adverb. When using a now, do not forget that the sentence should start with "THERE WAS .." and use an adjective to describe the noun.
2.4. Activity Four
Read the phrases and fill in the missing words. Use the words from the table and change their forms if necessary. When finished check your answers in QUIZ 9.4
from, provide, between, over, show, divide, scale,
compare, represent, to, during
1) The graph ____________the production of steel in 2012.
2) The vertical axis ________________ the amount of aluminium mined from 2000.
3) The horizontal/vertical axis _______________ into 10 units , each representing one
year of production.
4) The horizontal-vertical axis has a _______________ from 1to 100 %.
5) The graph _________________ information about the results of the tensile strength
test.
6) The chart _________________ fuel consumption of two types of engines.
7) ________________ 2005 and 2010 the production of giant crankshafts remained
constant.
8) __________ 2005 __________ 2010 the demand for iron ore dropped dramatically.
9) ____________ this period the car sales fluctuated.
10) _______________ this time our production recovered