Types of visuals to describe and comment on
Abschlussbedingungen
Please see the following chapter and complete a short test.
1. 9 types of visuals
According to Lohse et al (1994), „The types of visual representations occur in six types: graphs, tables, maps, diagrams, networks and icons. The variations on these types can also be classified according to the way they convey information and the efficiency in which they provide information.“
The main types of visuals EAP6 students often describe are briefly presented below:
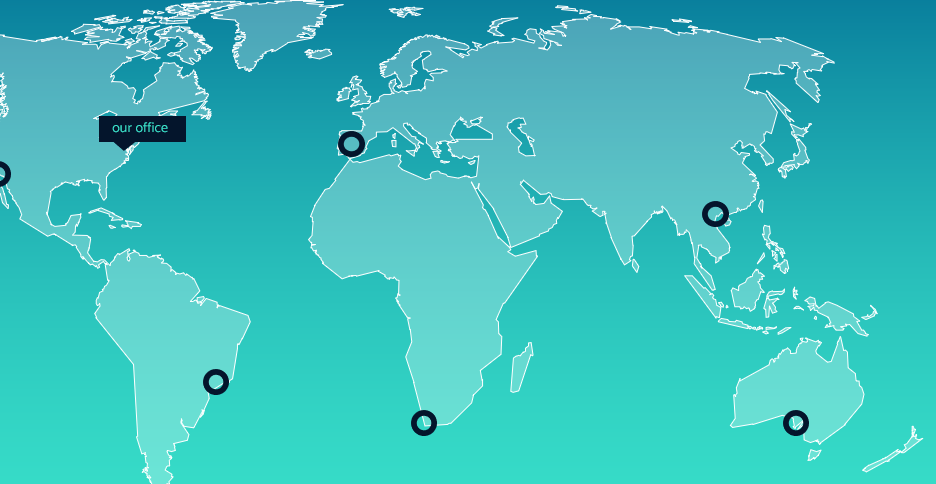
- a map — a drawing of the earth’s surface, or part of that surface, showing the shape and position of different countries, political borders, natural features such as rivers and mountains, and artificial features such as roads and buildings;
- line graph — a drawing that uses lines to show how different pieces of information are related to each other; 8

- bar chart (histogram)— a mathematical picture in which different amounts are represented by thin vertical or horizontal rectangles that have the same width but different heights or lengths;

- table — an arrangement of facts and numbers in rows or blocks;
- process / flow-chart — a drawing that shows the stages of a process or activity from the beginning to the end using different shapes connected by lines;

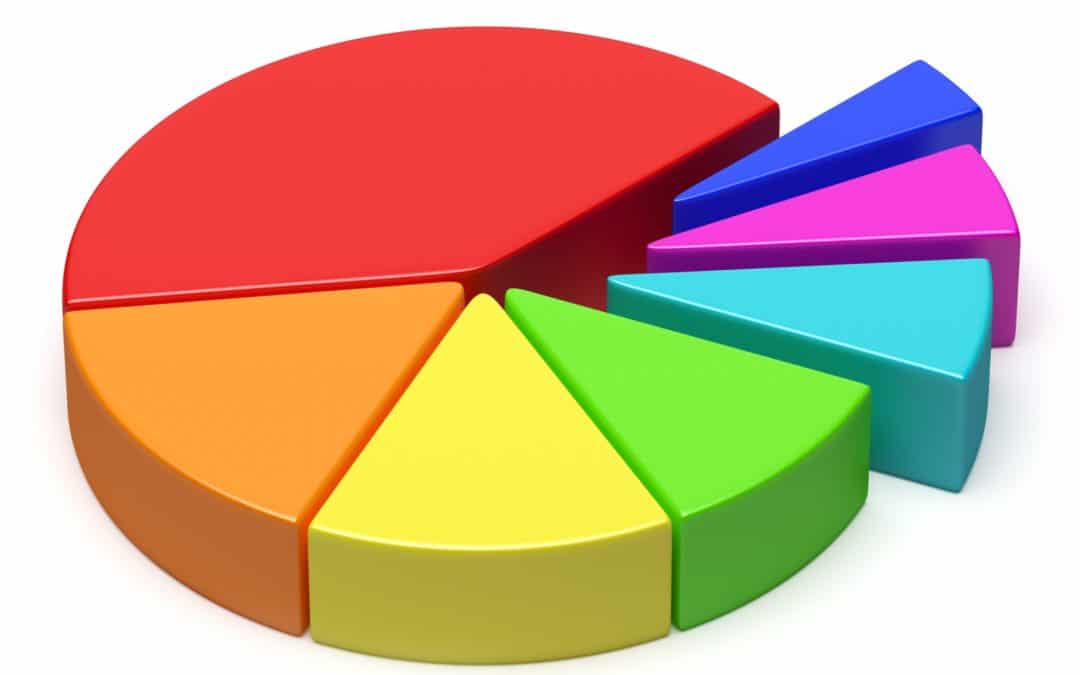
- pie chart — a way of showing information about how a total amount is divided up, consisting of a circle that is divided from its centre into several parts;
- word cloud — a way of demonstrating the connection and frequency of the words used in a specific text;

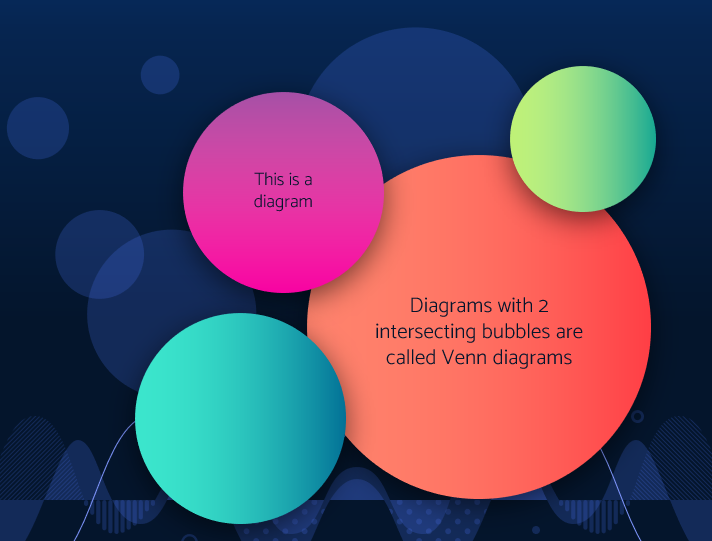
- diagram — a way of presenting ideas visually
- box plot — this type of visual used in desctiptive statistics distribution of numerical data and skewness through displaying the data quartiles (or percentiles) and averages