
How to describe ANY visual material: 5 Basic Steps
There are 5 steps you have to take when you want to describe an image:
1. Describe what it looks like (diagram type) and what it shows (the main information)
2. Talk about its contents (axes X and Y; parts; pieces; columns and lines)
3. Highlight the trend: mention some outstanding data
4. Cover the details: mention important smaller pieces of information
5. Make a conclusion and provide your evaluation: what can we take away?
Source: Author's own materials (Olesya Petrenko)
Please try it out using these 2 simple visuals:
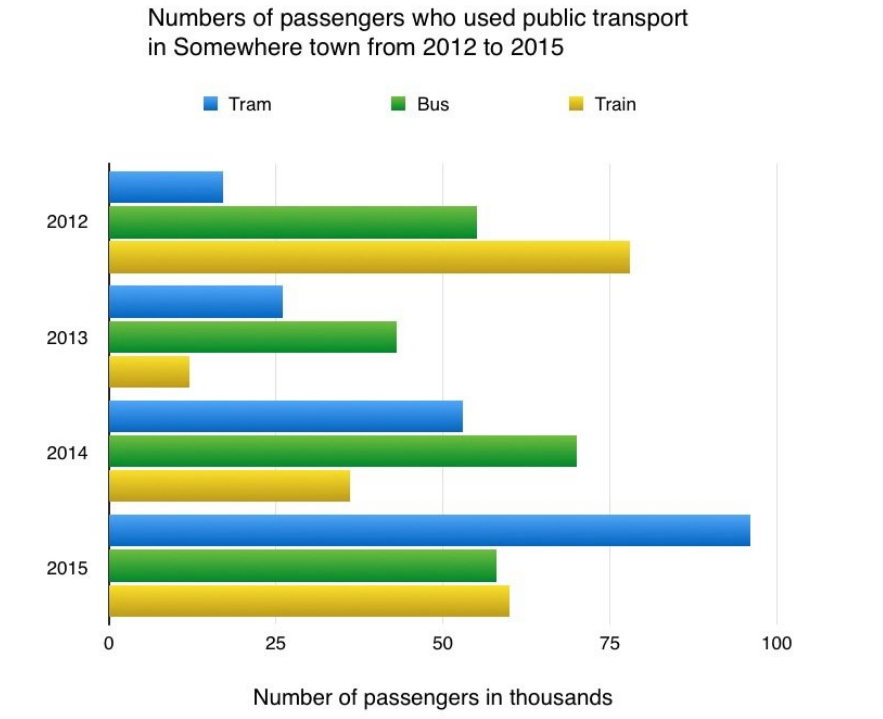
1. 
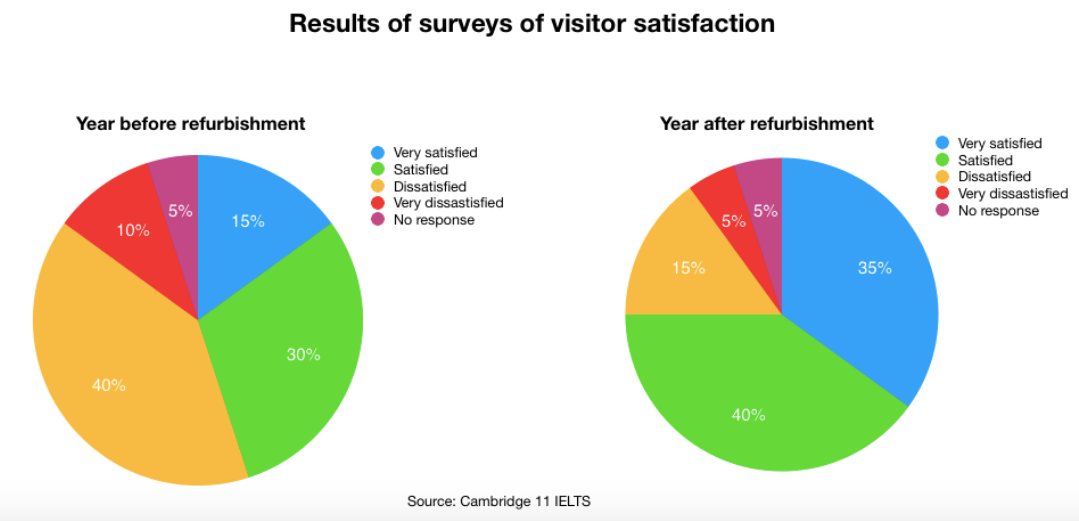
2. 
Once you are done, you can view model answers below:
1. Bar Graph
There are 5 steps you have to take when you want to describe an image:
1. Describe what it looks like (diagram type) and what it shows (the main information)
2. Talk about its contents (axes X and Y; parts; pieces; columns and lines)
3. Highlight the trend: mention some outstanding data
4. Cover the details: mention important smaller pieces of information
5. Make a conclusion and provide your evaluation: what can we take away?
Source: Author's own materials (Olesya Petrenko)
Please try it out using these 2 simple visuals:
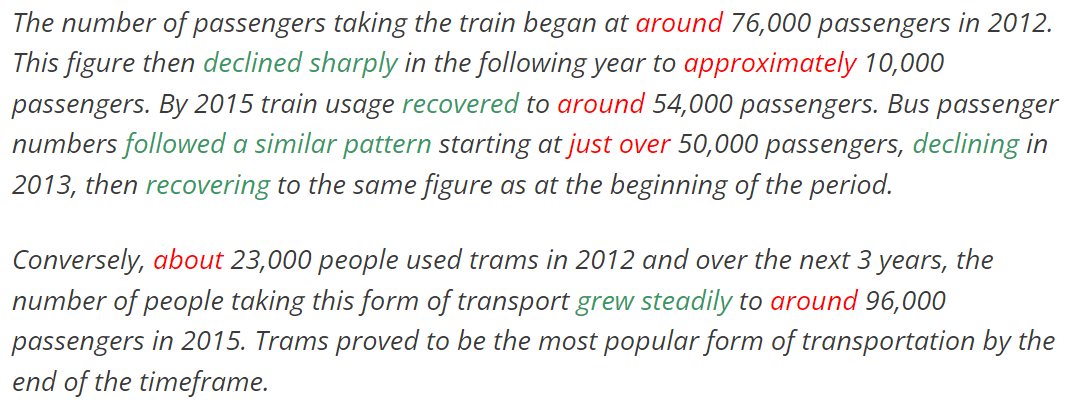
1. 
2. 
Once you are done, you can view model answers below:

(adapted from https://ieltsfocus.com/2017/04/11/ielts-bar-graph-model-answer/)