
Vocabulary 1
Requisitos de finalización
Employment by education level (tertiary) in
the Czech Republic, % of 25-64 year-olds, 1994 – 2019
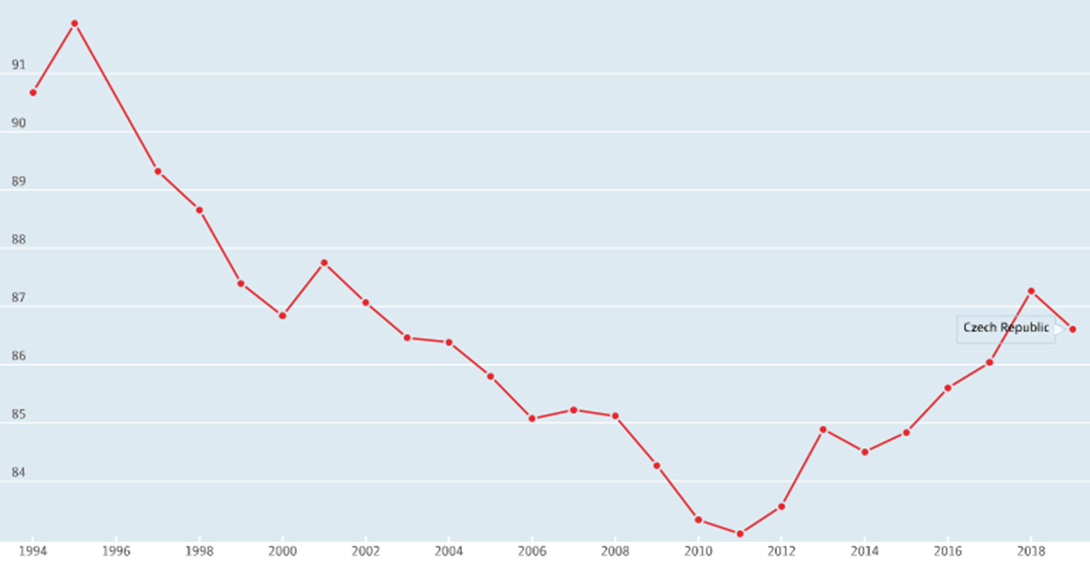
Source: the European Skills and Jobs Survey conducted in 2014
Look at the line graph again and answer the following questions as quickly as possible.
- What does the curve show/depict? What information does the graph provide?
– It describes the evolution of … .
- What does the x-axis (horizontal axis) show? What does the y-axis (vertical axis) show?
- What scale does the horizontal axis have? (from… to…)
- What was the employment rate in the Czech Republic in 2013? / What value did the employment rate reach in 2013?
- In which year did the employment rate in the Czech Republic decline to approximately 83.5%?
- When did the employment rate in the Czech Republic reach its peak?
- When was the employment rate in the Czech Republic almost the same as in 2008?
- In which period was there an almost continuous fall in the employment rate in the Czech Republic?
- In your opinion, what was the reason for the decline between 2008 and 2011?
- What happened to the employment rate in the Czech Republic between 2014 and 2018? – In this period, …
NB: The boldfaced expressions are particularly useful when describing a line graph. Make sure you understand them.
Vocabulary activities 1-3 are designed by Mgr. Hammarova and Mgr. Heinlova, Ph.D.
For more activities linked to this line graph, please click on the Take the Test button below:Método de calificación: Calificación más alta